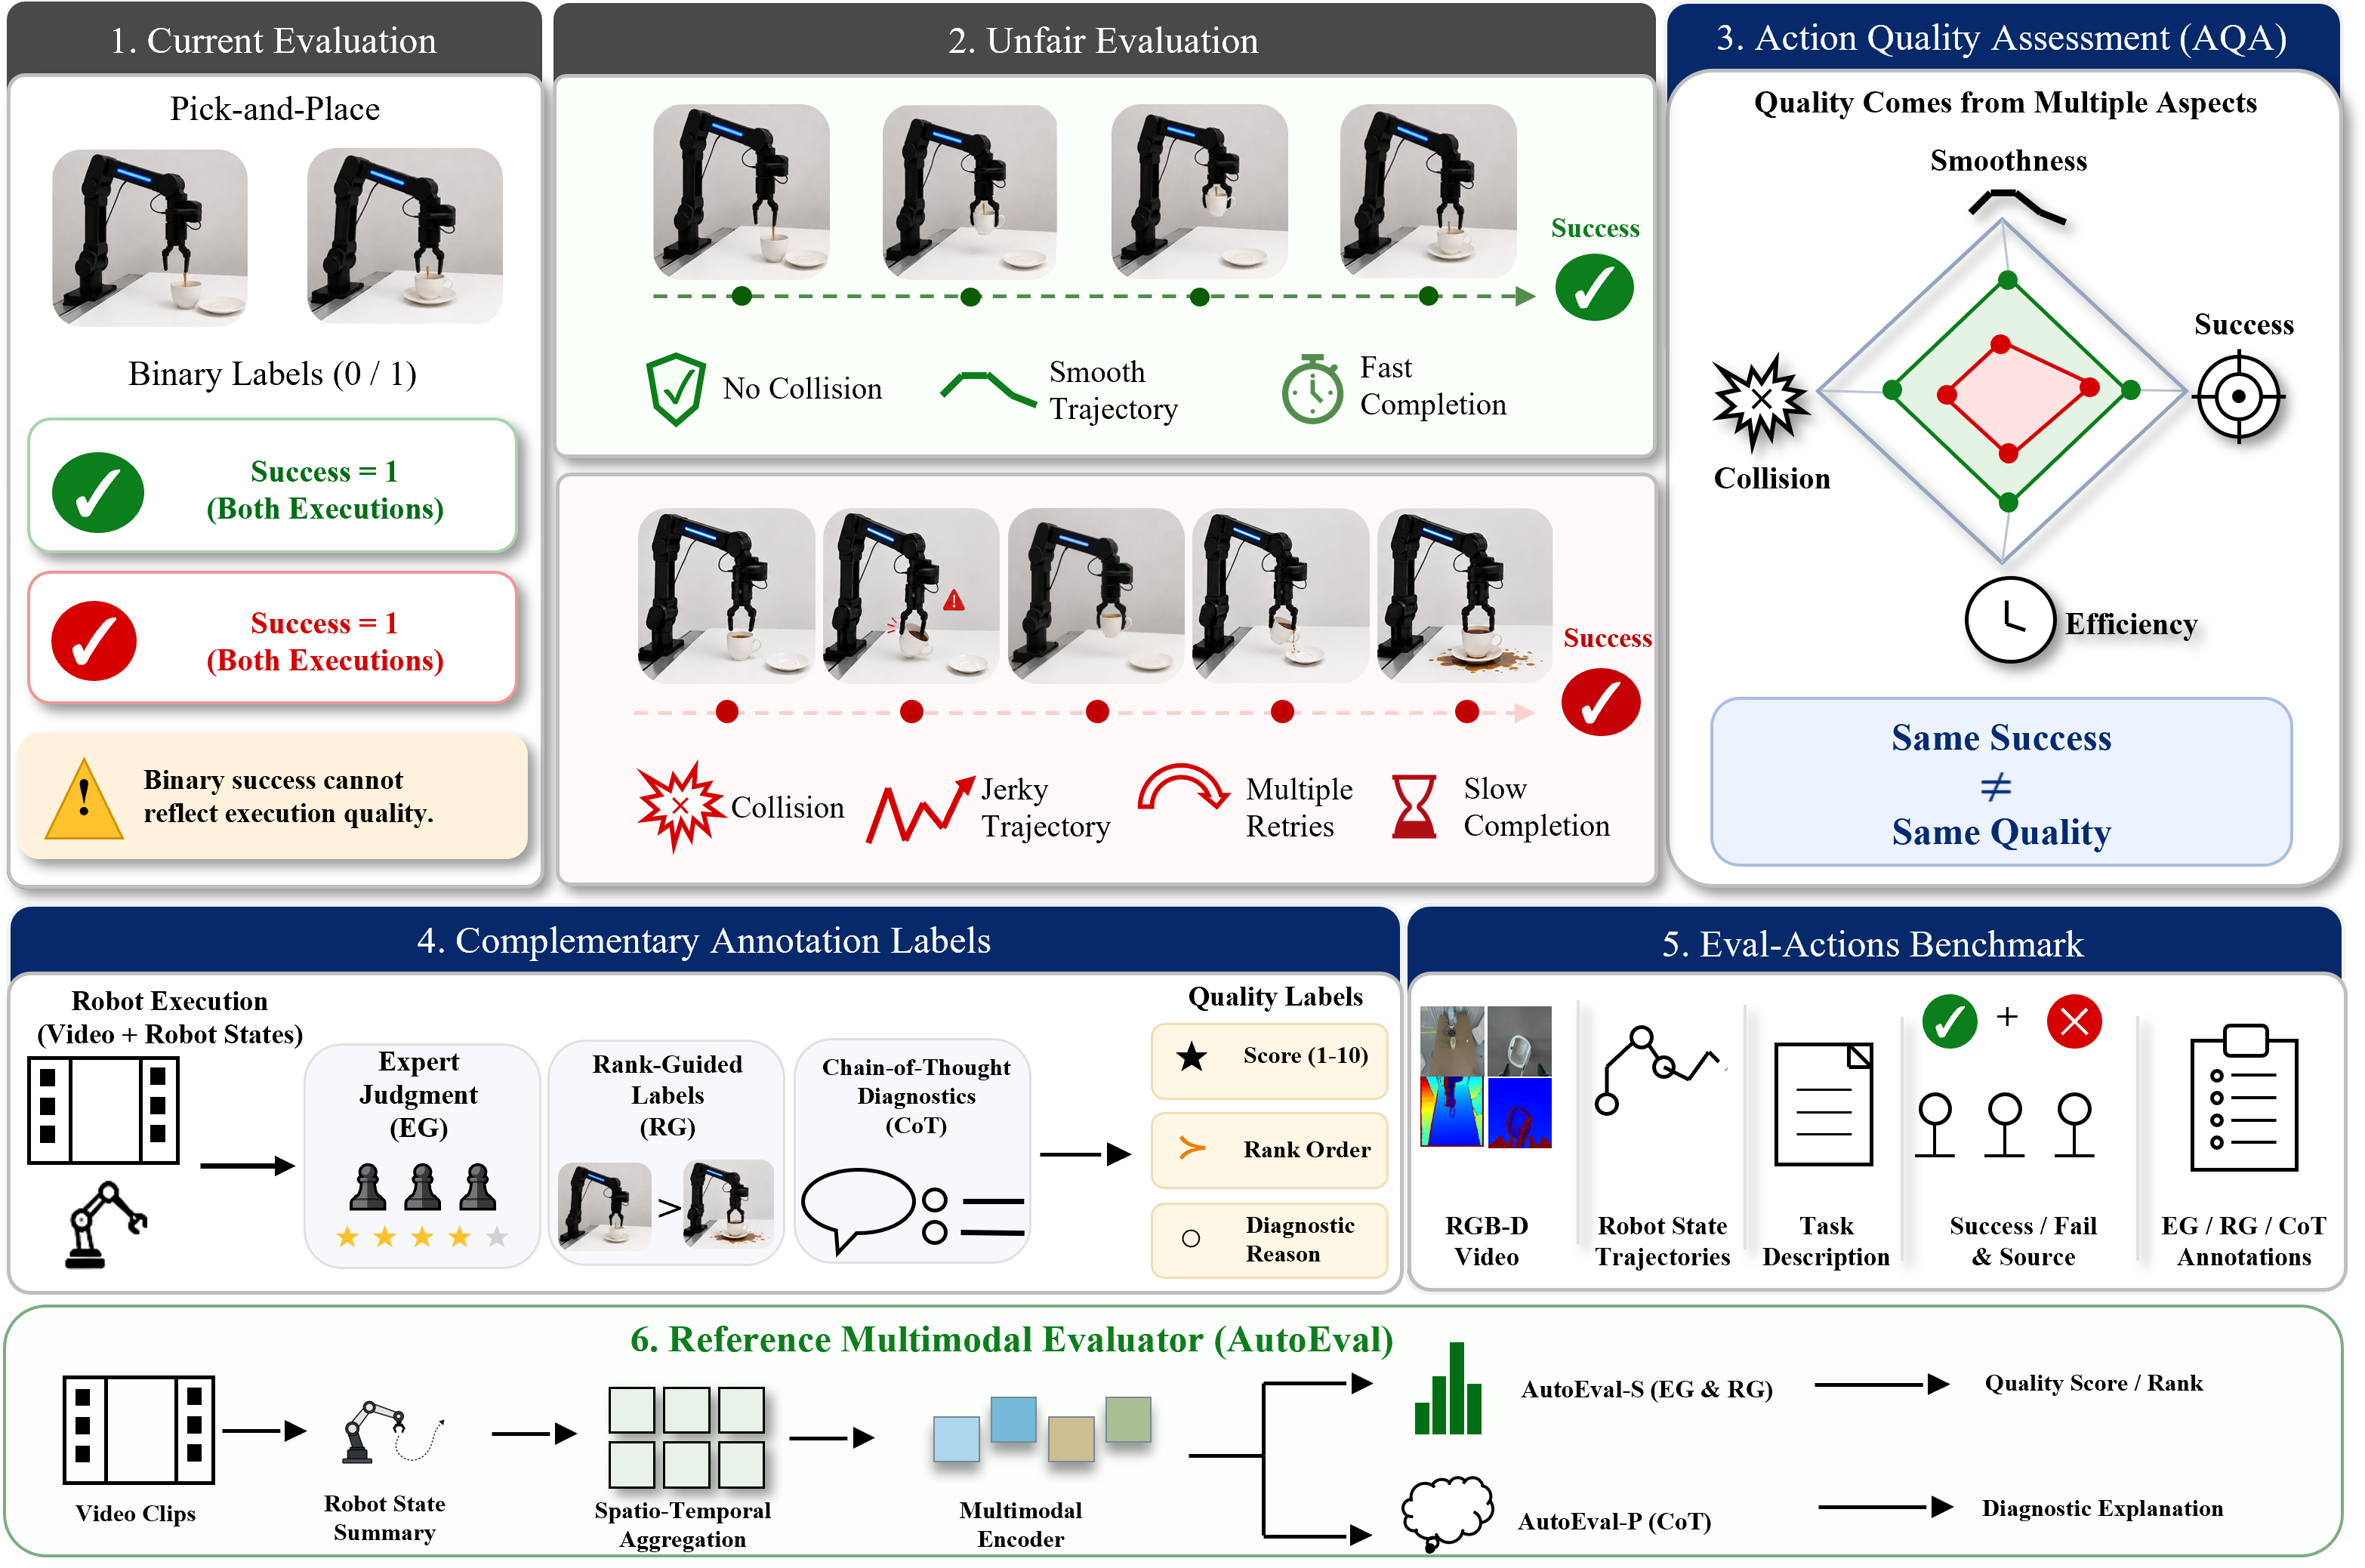
Figure 1. Motivation and overview of the Eval-Actions diagnostic evaluation framework. Conventional manipulation evaluation often reduces each execution to a binary success/failure label, which cannot distinguish process quality among successful executions. Eval-Actions assesses execution quality from task completion, motion smoothness, execution efficiency, and visible collision-related events, provides EG/RG/CoT annotation labels, and introduces AutoEval as a reference multimodal evaluator for quality scores, rankings, and CoT-style diagnostic explanations.
Although Vision-Action (VA) and Vision-Language-Action (VLA) policies have substantially improved robotic manipulation, most evaluation protocols still rely on binary success rates, which cannot distinguish low-quality successes from smooth and efficient executions. This paper introduces Eval-Actions as a triadic evaluation methodology and diagnostic benchmark for fine-grained execution-quality assessment in real-robot manipulation. The proposed protocol combines three complementary supervision views: criteria-based Expert Grading (EG), Rank-Guided (RG) labels, and Chain-of-Thought-style (CoT) diagnostic annotations. Eval-Actions instantiates this protocol with 13K+ real-robot episodes across 150+ tasks and approximately 52 hours of recordings, including RGB-D videos, robot-state trajectories, task descriptions, success/failure labels, and auxiliary trajectory-source labels from teleoperated and policy-generated executions. To operationalize the protocol, we provide AutoEval as a reference multimodal evaluator. AutoEval-S predicts EG/RG quality scores and task outcomes from RGB temporal evidence and compact kinematic summaries, while AutoEval-P generates CoT-style diagnostic explanations with GRPO-based explanation-prediction alignment.
Figure 2. Overview of the Eval-Actions benchmark. The figure illustrates task diversity across 150+ scenarios, including single-arm interactions and bimanual coordination tasks; a detailed case study with demonstrations ranging from high-quality successes to failures; and the data composition of each episode, including RGB-D sensory data, 7/14-DoF joint trajectories, task descriptions, success/failure labels, trajectory-source labels, and a fine-grained quality radar chart over task completion, smoothness, collision-related events, and efficiency.
Table I. Comparison of representative robotic manipulation datasets. Existing datasets target policy training, focusing on trajectory quantity and diversity. Eval-Actions is designed for diagnostic evaluation and includes failure cases, mixed trajectory sources, fine-grained quality scores, and CoT-style explanatory annotations based on RGB-D videos and robot trajectories.
| Dataset | Episodes | Tasks | Hours | Failures | Split |
|---|---|---|---|---|---|
| Full Eval-Actions | 13K+ | 150+ | 52 | 2.8K | - |
| EAS | 6K+ | 50+ | 12 | 37.4% | 80% / 10% / 10% |
Table IV. Statistics of the full Eval-Actions benchmark and the annotation-complete Eval-Actions Small (EAS) subset. The failure entry for EAS reports the failure ratio computed on the annotation-complete subset; AutoEval experiments are conducted on EAS unless otherwise specified.
Figure 3. Representative task statistics of Eval-Actions. The top chart shows the distribution of demonstration counts for each representative task, while the bottom chart shows the total duration in seconds for the corresponding tasks. These tasks cover diverse manipulation scenarios, including both single-arm and dual-arm operations.
Figure 4. Distribution of Expert Grading scores in the Eval-Actions Small (EAS) subset. The chart shows the proportions of failed executions and successful executions at different quality levels over the 1-10 score range.
Figure 5. Overview of the proposed AutoEval framework. AutoEval takes a robot manipulation video sequence and a compact kinematic summary as inputs. AutoEval-S is used for structured prediction under the EG and RG protocols, where Spatio-Temporal Aggregation tiles neighboring frames into composite visual inputs to preserve short-term motion cues under a fixed VLM visual-input budget. AutoEval-P is used for CoT-style diagnostic explanation generation and is optimized with Group Relative Policy Optimization, encouraging consistency between diagnostic explanations and structured predictions.
AutoEval is evaluated on the annotation-complete Eval-Actions Small (EAS) split across EG, RG, and CoT protocols, using RGB temporal evidence and compact kinematic summaries.
| Method | Protocol | SRCC ↑ | Rℓ2 ↓ | Success Acc. ↑ | Source Acc. ↑ |
|---|---|---|---|---|---|
| InternVL3.5-4B (w/o SFT) | RG | 0.02 | 27.97 | 62.3% | 38.8% |
| QwenVL3-4B | RG | 0.82 | 4.55 | 91.0% | 99.1% |
| AutoEval-S | EG | 0.81 | 3.45 | 90.6% | 99.1% |
| AutoEval-S | RG | 0.84 | 3.49 | 91.0% | 99.6% |
| AutoEval-P | CoT | 0.70 | 4.45 | 83.0% | 86.9% |
Table VI. Comparative performance analysis on the Eval-Actions benchmark. Results are reported across three protocols: Expert Grading (EG), Rank-Guided (RG), and Chain-of-Thought (CoT). To quantify the domain gap, the zero-shot performance of representative VLMs without supervised fine-tuning is included; the near-zero correlations indicate the importance of task-specific fine-tuning.
Structured generalization is evaluated on held-out tasks, held-out robot arms, and cross-dataset splits. Each split contains 50 trajectories; T+A denotes unseen tasks and unseen arms.
| Split | Model | Protocol | SRCC ↑ | Rℓ2 ↓ | Success Acc. ↑ | Source Acc. ↑ |
|---|---|---|---|---|---|---|
| Unseen Task + Arm | AutoEval-S | RG | 0.75 | 6.12 | 88.0% | 90.0% |
| Unseen Arm | AutoEval-S | RG | 0.79 | 4.31 | 90.0% | 96.0% |
| Unseen Task | AutoEval-S | RG | 0.76 | 4.74 | 88.0% | 92.0% |
| RoboMIND-S | AutoEval-S | RG | 0.78 | 4.88 | 90.0% | 94.0% |
| Open-X-S | AutoEval-S | RG | 0.83 | 4.13 | 96.0% | 98.0% |
Table IX. Structured generalization on held-out tasks and robot arms. Arm and Task denote unseen-arm-only and unseen-task-only splits; RoboMIND-S and Open-X-S provide additional cross-dataset distribution shifts. Succ. and Src. report success-prediction and source-prediction accuracies.
Policy-level ranking uses AutoEval-S under the EG protocol. Each policy-task pair is evaluated with 20 rollout trials, and the reported score and success rate are averaged over evaluated tasks and rollouts.
| Policy | Avg. AutoEval-EG Score | Success Rate | Quality Rank |
|---|---|---|---|
| π0.5 (held-out) | 6.23 | 72% | 1 |
| π0 | 4.47 | 68% | 2 |
| ACT | 3.70 | 40% | 3 |
| RDT | 2.43 | 56% | 4 |
| DP (held-out) | 2.12 | 42% | 5 |
Table X. Policy-level ranking using AutoEval-S under the EG protocol. Held-out denotes policy models whose rollout trajectories are excluded from the AutoEval training split.